Tech Ideas & Best Practices
In today’s digital era, businesses rely on SharePoint for collaboration and data management. However, SharePoint alone cannot provide advanced analytics. By connecting SharePoint with Power BI, organizations can transform static lists and documents into interactive, data-driven dashboards that drive smarter decision-making.
Why Connect SharePoint with Power BI?
Integrating SharePoint and Power BI offers several advantages:
- Centralized Data Access: Use SharePoint as a single source of truth and visualize it in Power BI.
- Real-Time Insights: Keep dashboards updated with automated refreshes.
- Better Decision-Making: Convert raw SharePoint data into meaningful visualizations.
- Microsoft Ecosystem Integration: Both tools seamlessly connect with Office 365 and Azure.
How to Connect SharePoint with Power BI
1. Connect SharePoint Lists to Power BI
SharePoint lists often hold structured project or business data.
Steps to connect:
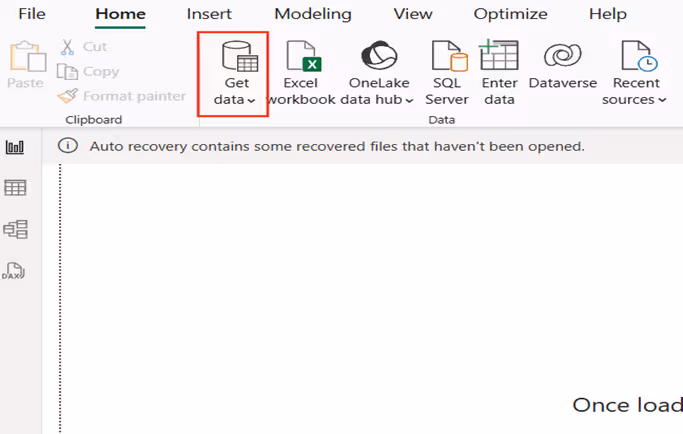
1. Open Power BI Desktop → Get Data.
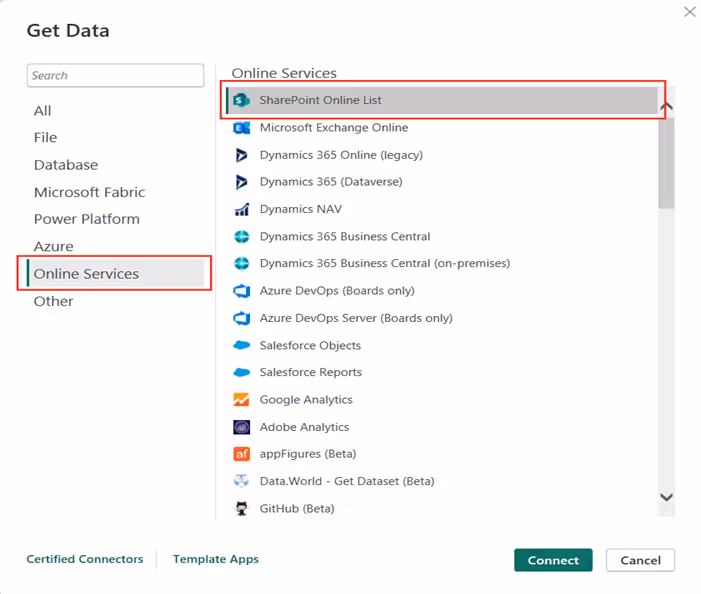
2. Select SharePoint Online List.
3. Enter your SharePoint site URL (e.g., https://company.sharepoint.com/sites/project).
4. Sign in with organizational credentials.
5. Load the required lists into Power BI.
Best for: task management, issue tracking, and HR records.

Connecting SharePoint with Power BI for Data-Driven Dashboards
In today’s digital era, businesses rely on SharePoint for collaboration and data management.

Prerequisites
- Access to Power Automate
- Published Dataset
- Power BI Desktop
Power BI and Power Automate have emerged as powerful tools to harness the potential of data. In this blog post, we'll explore a practical scenario where you can seamlessly send notifications based on Power BI data using Power Automate. Specifically, we'll walk through the process of sending notifications to users who haven't logged their work hours, demonstrating the efficiency and ease of integrating these Microsoft Power Platform tools.
Example: Work Hours Tracking Notification
This example demonstrates how to send an email notification to users who haven't logged their worked hours:
Steps 1: Power BI Desktop
To start the process, open the report in Power BI Desktop and follow these steps:
- Create a new tab: Add a "Power Automate" tab or any descriptive name.
- Add Visual: Add a table Visual from the visualization pane
- Apply filters: Select "Visualizations"> "Filters" and create a filter where "Logged Hours" equals 0.

- Performance Analysis: Navigate to the Optimize tab and select Performance Analyzer. Start recording, then click Refresh Visual to capture and analyze the query.


- Copy Query: Once the performance analysis is complete, copy the generated query. This will be crucial for the subsequent steps in Power Automate.
Step 2: Power Automate Integration
Now, let's seamlessly integrate Power BI data with Power Automate to automate notifications:
- Create a flow: Click "Create" > "Scheduled Cloud Flow".
- Set the frequency: Choose the desired interval for checking (e.g., daily, hourly).
- Add a trigger: Search for "Power BI" > "Run a query against a dataset."
- Select the workspace and then choose the dataset from the dropdown menu.

- Input Query Text: Paste the previously copied query from Power BI Desktop into the Query Text field. This ensures that Power Automate retrieves the specific dataset based on your defined criteria.
- Parse the retrieved data.
- Condition Check (Optional): Set up any additional condition to check if needed.

- Send Notification: Add Send an email action to send a notification.
Schedule Your Expert Session
Are you on the lookout for top-tier Power BI consultancy or specialized Power Automate consulting services to enhance your business's data management and automation strategies? Look no further! Our team of seasoned experts is here to guide you through the complexities of data visualization and process automation, ensuring your business leverages the full spectrum of capabilities offered by Power BI and Power Automate.
Don't miss this opportunity to transform your data strategy and automation processes. Connect with us. Schedule your consultation today with our experts. Our dedicated support will help you navigate the evolving digital landscape, ensuring your business remains ahead of the curve. Let's work together to turn your data into your most powerful asset and optimize your workflows for maximum efficiency.

How to run a query against a dataset in power automate?
Power BI and Power Automate have emerged as powerful tools to harness the potential of data. In this blog post, we'll explore a practical scenario where you can seamlessly send notifications based on Power BI data using Power Automate.

What is data refresh in Power BI?
Power BI serves as a crucial bridge connecting raw data to analytical tools, emphasizing the importance of maintaining current datasets for accuracy. Without regular updates, data becomes outdated, leading to unreliable analytics and misguided decisions. Refreshing your data in Power BI ensures you're working with the most recent information, allowing for effective tracking of data shifts, trends, and patterns. This process not only aids in making informed decisions but also in fine-tuning strategies based on evolving data insights.
Furthermore, refreshing data in Power BI can uncover discrepancies or errors, such as issues with the data source or its linkage to Power BI, indicating potential updating failures. Addressing these discrepancies is essential for guaranteeing the precision and trustworthiness of your data analysis.
Prerequisites
- Access to Power BI service
- Access to Power Automate
- A published Power BI dataset
To ensure your Power BI reports always reflect the latest trends, automating dataset refresh is crucial. This blog explores two effective methods: Scheduled refresh and Power Automate.
Method 1: Scheduled Refresh - Simple and Straightforward
- Navigate to your Dataset: In the Power BI Service, locate the dataset you want to automate.
- Access Settings: Click on the ellipsis (...) next to the dataset name and select "Settings."

- Schedule the Refresh: Under "Semantic Model," find the "Scheduled refresh" section. Click "Enable" and choose your desired refresh schedule. Options include hourly, daily, weekly, or monthly intervals.

- Save and Relax: Click "Apply" to activate the schedule. Power BI will automatically fetch new data based on your chosen frequency.
Method 2: Power Automate - Advanced Automation
- Create a Flow in Power Automate: Click here Power Automate and sign in. Click "Create" and choose a flow template (e.g., "Instant Cloud Flow" or “Scheduled Cloud flow”).

- Connect to Power BI: Search for the "Power BI - Refresh a Dataset" action and add it to your flow.
- Select Dataset: Choose the dataset you want to refresh.

- Save and Test: Click "Save" and run a test to ensure the flow functions correctly.
For additional expert guidance or services, don't hesitate to reach out for our Power BI consulting services. Our team of skilled Power BI consultants is ready to assist you in leveraging the full potential of your data analytics and reporting needs.

How to Refresh Power BI Dataset Automatically in 2024
Power BI serves as a crucial bridge connecting raw data to analytical tools, emphasizing the importance of maintaining current datasets for accuracy.
Once you've created a report in Power BI, you can easily share it with others by embedding it into a SharePoint site page. This allows your colleagues and collaborators to view your report with out having to access Power BI directly.
Prerequisites
- A Power BI report published to the Power BI service.
- A SharePoint site with access permissions.
- Power BI web part installed on the SharePoint site.
Steps to Embed a Power BI Report into a SharePoint Site Page
1. Open the SharePoint site page where you want to embed the report.
2. Click the Edit button in the top right corner of the page.
3. Click the + New button in the top left corner of the page.
4. Search for and select the Power BI web part.

5. Click the Add report button.
6. Copy the embed URL of the Power BI report you want to embed. You can find the embed URL by opening the report in Power BI, clicking the File tab, and then selecting Embed in SharePoint Online.

7. Paste the embed URL into the Power BI report link field in the web part properties pane.
8. Select the Show Filter Pane and Show Navigation Pane checkboxes if you want these features to be visible in the embedded report.

9. Click the Publish button to publish the SharePoint page and make the embedded report visible to others.
Explore our previous blog, The Ultimate Step-by-Step Guide to Power BI Report Creation for a detailed walk through on crafting reports in Power BI. Dive into the steps for expert insights. Connect with our Power BI Consultants for expert guidance on embedding reports in SharePoint. For more insights like this, join our weekly newsletters and follow our blog updates.

Easy 9 Steps Guide to Embed Power BI Report in SharePoint
Once you've created a report in Power BI, you can easily share it with others by embedding it into a SharePoint site page.
Power BI is a business intelligence (BI) tool that allows you to connect to your data, create visualizations, and share insights with others.
Prerequisites
- Power BI Desktop installed on your computer.
- A dataset that you want to connect to. (Here we will use SharePoint List)
Step 1: Connect to Your Data
The first step in creating a report is to connect to your data. Power BI can connect to a variety of data sources, including Excel spreadsheets, CSV files, SQL databases, and cloud services like OneDrive and many more.
To connect to your data,
- Open Power BI Desktop and click on the Get Data button.
- Click more and select Online Services -> SharePoint Online List.

- Follow the prompts to connect.
Step 2: Create Visualizations
Once you have connected to your data, you can start creating visualizations. Power BI offers a wide variety of visualizations, including charts, graphs, maps, and pie charts.
To create a visualization, Click a visual from the Visualizations pane. Power BI will automatically create a visualization based on the visual that you selected.

To Add Data into to visual:
- Under Data Pane, Expand the Data Source (Timesheet)
- Drag and drop the fields into the visual as per your need.

Step 3: Add Filters and Slicers
Filters and slicers allow you to narrow down your data and see specific results. To add a filter, click on the Add Filter button in the Filters pane. To add a slicer, click on the Add Slicer button in the Visualizations pane.


Now you can also use slicer as a filter to play around with the table.
Similarly, you can also use slicer as a filter for the other columns available in your Data Source.
Step 4: Format Your Report
Once you have added your visualizations, filters, and slicers, you can format your report to make it look its best. You can change the font, colors, and layout of your report.
To format your report, click on the Format tab in the Visualizations pane. You can then make changes to the appearance of your report.

Step 5: Final Output

Step 6: Share Your Report
Once you are satisfied with your report, you can share it with others. Power Business Intelligence offers a variety of ways to share your report, including exporting it to a PDF file, publishing it to a webpage, or sending it via email.
- To share your report, click on the File tab in the top menu bar and select Share. Choose the sharing method that you want to use.
- To Publish your report, click Publish on the Top right and select the destination to publish your report.
Explore our blog, 'Easy 9 Steps Guide to Embed Power BI Report in SharePoint' for a comprehensive step-by-step guide on seamlessly integrating Power BI reports into SharePoint.
Join our weekly newsletters and regular blog updates for the latest insights and tips. Connect with our expert Business Intelligence Consultants for Power BI Services. Elevate your data strategy and make informed decisions. Contact us now to transform your analytics!

The Ultimate Step-by-Step Guide to Power BI Report Creation
Power BI is a business intelligence (BI) tool that allows you to connect to your data, create visualizations, and share insights with others.

